Analysis: Introducing PDO chart – 20.11.2018
Sweden is the best country in the floorball world.
Finland and Sweden are two best countries in the world.
Czech Republic, Switzerland, Finland and Sweden are the best four countries in the world.
These discussions and some proved by the history of the game arise every two years when World Floorball Championships take hold.
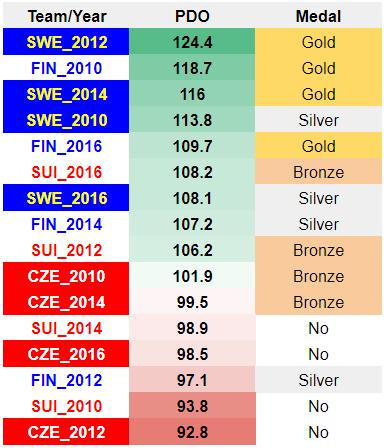
We looked at some basic stats from last four* Championships and compiled so called „PDO chart“ for four teams mentioned above.
PDO is a simple formula that sums “shooting percentage” and “goalkeeping save percentage” of a team.
Let´s have a look at the chart.
*There are no shots on goal data found for WFC prior to 2010.

Important note: Only data from games played against the best 8 teams at the tournament included (wish was not to include games with a score such as 15-1 as these could bring more bias to comparisons).
In the chart we see that Sweden is always pushed to the right side. This means their goalkeeping efficiency has very good results (you need more shots on them to score). Additionally, in 2012, Swedish offence was deadly, scoring on a record rate of more than 37%.
Only Finland in 2010 equaled Sweden in goalkeeping efficiency values. Finland is usually above average in shooting percentage values.
Switzerland represents itself with a solid shooting percentage and poor (in comparison only) goalkeeping percentage.
Czech Republic has usually problem to be efficient in shooting, their goalkeeping numbers are solid.
Two basic questions can arise looking at the chart. The first is:
The chart helps us to recognize the best country in floorball, right?
Yes, ability to score and prevent goals on efficient rates belongs to best teams and it is showing year by year (and not only at the WFC).
But is there something more? Look at the second question:
What´s up with the 2012 Fins?
How is it possible that Finland was so bad in 2012? The answer lies in what we already know about PDO. In the NHL (the best hockey league in the world), PDO chart is used mainly as an indicator of luck. In other words, it was researched that the most significant predictor of PDO is uncertainty or simply „luck“. It is good to have in mind that the NHL is pretty competitive league with no big differences among teams (unlike floorball). You still find some better PDO teams over time in the NHL with good shooters and goalies but these values do not go outside 97 and 103 interval per season. What makes the PDO value to be extreme is lack of data, in other words not enough games. PDO over time converges to the value of 100 with certain variability (can be assigned to quality of teams). On tournaments such as World Floorball Championships, lack of data problem is always present. Knowing all of this makes me feel confident saying 2012 Finish flaws were influenced mainly by lack of luck.
Why PDO?
PDO gives us the best correlation with final results of teams in last four World Floorball Championships. We can also test share of shots on goal for (Shots For%, calculated as “shots on goal for” divided by “shots on goal for and against”) or Shooting percentage (Shooting%) and Goalkeeping save percentage (Goalkeeping%) itselfs and correlations are these:
-0.79 Tournament results + PDO
-0.72 Tournament results + Shooting%
-0.67 Tournament results + Shots For%
-0.61 Tournament results + Goalkeeping%
Closer to value -1 the greater influence statistic has on final results.
As we can see, all metrics are important (less than -0.6 is strong correlation) for good teams. At the end of the day it is PDO that your country must ride high in order to take the most precious medals.
So what do you think? How much things changed over last few years? Does Sweden still have some edge over Finland? Can Switzerland repeat or improve their PDO from 2016 in order to get to Finals? Can host country Czech Republic add efficiency to their game this year? Soon we will find out!
By Petr Malina
News
1 - 20 / 146


WFC 2018 in facts and figures – 10.1.2019
Data Analysis: WFC Summary – 12.12.2018
Data Analysis: WFC Summary – 12.12.2018
Data Analysis: Finland vs Sweden 6:3 – 12.12.2018
Data Analysis: Sweden vs Switzerland 5:4 ps. – 11.12.2018
Data Analysis: Czechia vs Switzerland 2-4 – 11.12.2018
Final Day of WFC: Gold Goes to Finland, Silver to Sweden, Switzerland Takes Bronze, Czechs Again without Medal – 9.12.2018
Pascal Meier is the MVP of WFC 2018 – 9.12.2018
WFC 2018 All Star Team – 9.12.2018
Finland Beats Sweden 6:3 to Defend World Champions Title – 9.12.2018
Switzerland Overcomes Czech Republic to Win Bronze Medals – 9.12.2018
Another spectator record broken! – 9.12.2018
Data Analysis: Czech Republic vs Finland 2-7 – 9.12.2018
Latvia Beats Germany to Earn 5th Spot – 9.12.2018
Norway Again Outplays Denmark to Finish in 7th Place – 9.12.2018
DAY 9: Grand Finale Is Here! New Champions to Be Crowned Today! – 9.12.2018
Day 8 Summary: Sweden and Finland in Final Again, Switzerland and Czech Republic to Play for Bronze – 9.12.2018
Sweden Becomes Second Finalist after Thrilling Shoot-out Win – 8.12.2018
Finland Defeats Czech Republic Thanks to Brilliant Scoring Efficiency – 8.12.2018
Germany Beats Denmark 4-2 to Fight for 5th Place Tomorrow – 8.12.2018